> ## Documentation Index
> Fetch the complete documentation index at: https://www.traceloop.com/docs/llms.txt
> Use this file to discover all available pages before exploring further.
# Ruby
> Install OpenLLMetry for Ruby by following these 3 easy steps and get instant monitoring.
This is still in beta. Give us feedback at [dev@traceloop.com](mailto:dev@traceloop.com)
Run the following command in your terminal:
```bash gem theme={null}
gem install traceloop-sdk
```
```bash bundler theme={null}
bundle add traceloop-sdk
```
In your LLM app, initialize the Traceloop tracer like this:
If you're using Rails, this needs to be in `config/initializers/traceloop.rb`
```ruby theme={null}
require "traceloop/sdk"
traceloop = Traceloop::SDK::Traceloop.new
```
 For now, we don't automatically instrument libraries on Ruby (as opposed to Python and Javascript).
This will change in later versions.
This means that you'll need to manually log your prompts and completions.
```ruby theme={null}
require "openai"
client = OpenAI::Client.new
# This tracks the latency of the call and the response
traceloop.workflow("joke_generator") do
traceloop.llm_call(provider="openai", model="gpt-3.5-turbo") do |tracer|
# Log the prompt
tracer.log_prompt(user_prompt="Tell me a joke about OpenTelemetry")
# Or use the OpenAI Format
# tracer.log_messages([{ role: "user", content: "Tell me a joke about OpenTelemetry" }])
# Call OpenAI like you normally would
response = client.chat(
parameters: {
model: "gpt-3.5-turbo",
messages: [{ role: "user", content: "Tell me a joke about OpenTelemetry" }]
})
# Pass the response form OpenAI as is to log the completion and token usage
tracer.log_response(response)
end
end
```
Lastly, you'll need to configure where to export your traces.
The 2 environment variables controlling this are `TRACELOOP_API_KEY` and `TRACELOOP_BASE_URL`.
For Traceloop, read on. For other options, see [Exporting](/openllmetry/integrations/introduction).
### Using Traceloop Cloud
You need an API key to send traces to Traceloop.
[Generate one in Settings](https://app.traceloop.com/settings/api-keys) by selecting
a project and environment, then click **Generate API key**.
⚠️ **Important:** Copy the key immediately - it won't be shown again after you close or reload the page.
[Detailed instructions →](/settings/managing-api-keys)
Set the API key as an environment variable in your app named `TRACELOOP_API_KEY`:
```bash theme={null}
export TRACELOOP_API_KEY=your_api_key_here
```
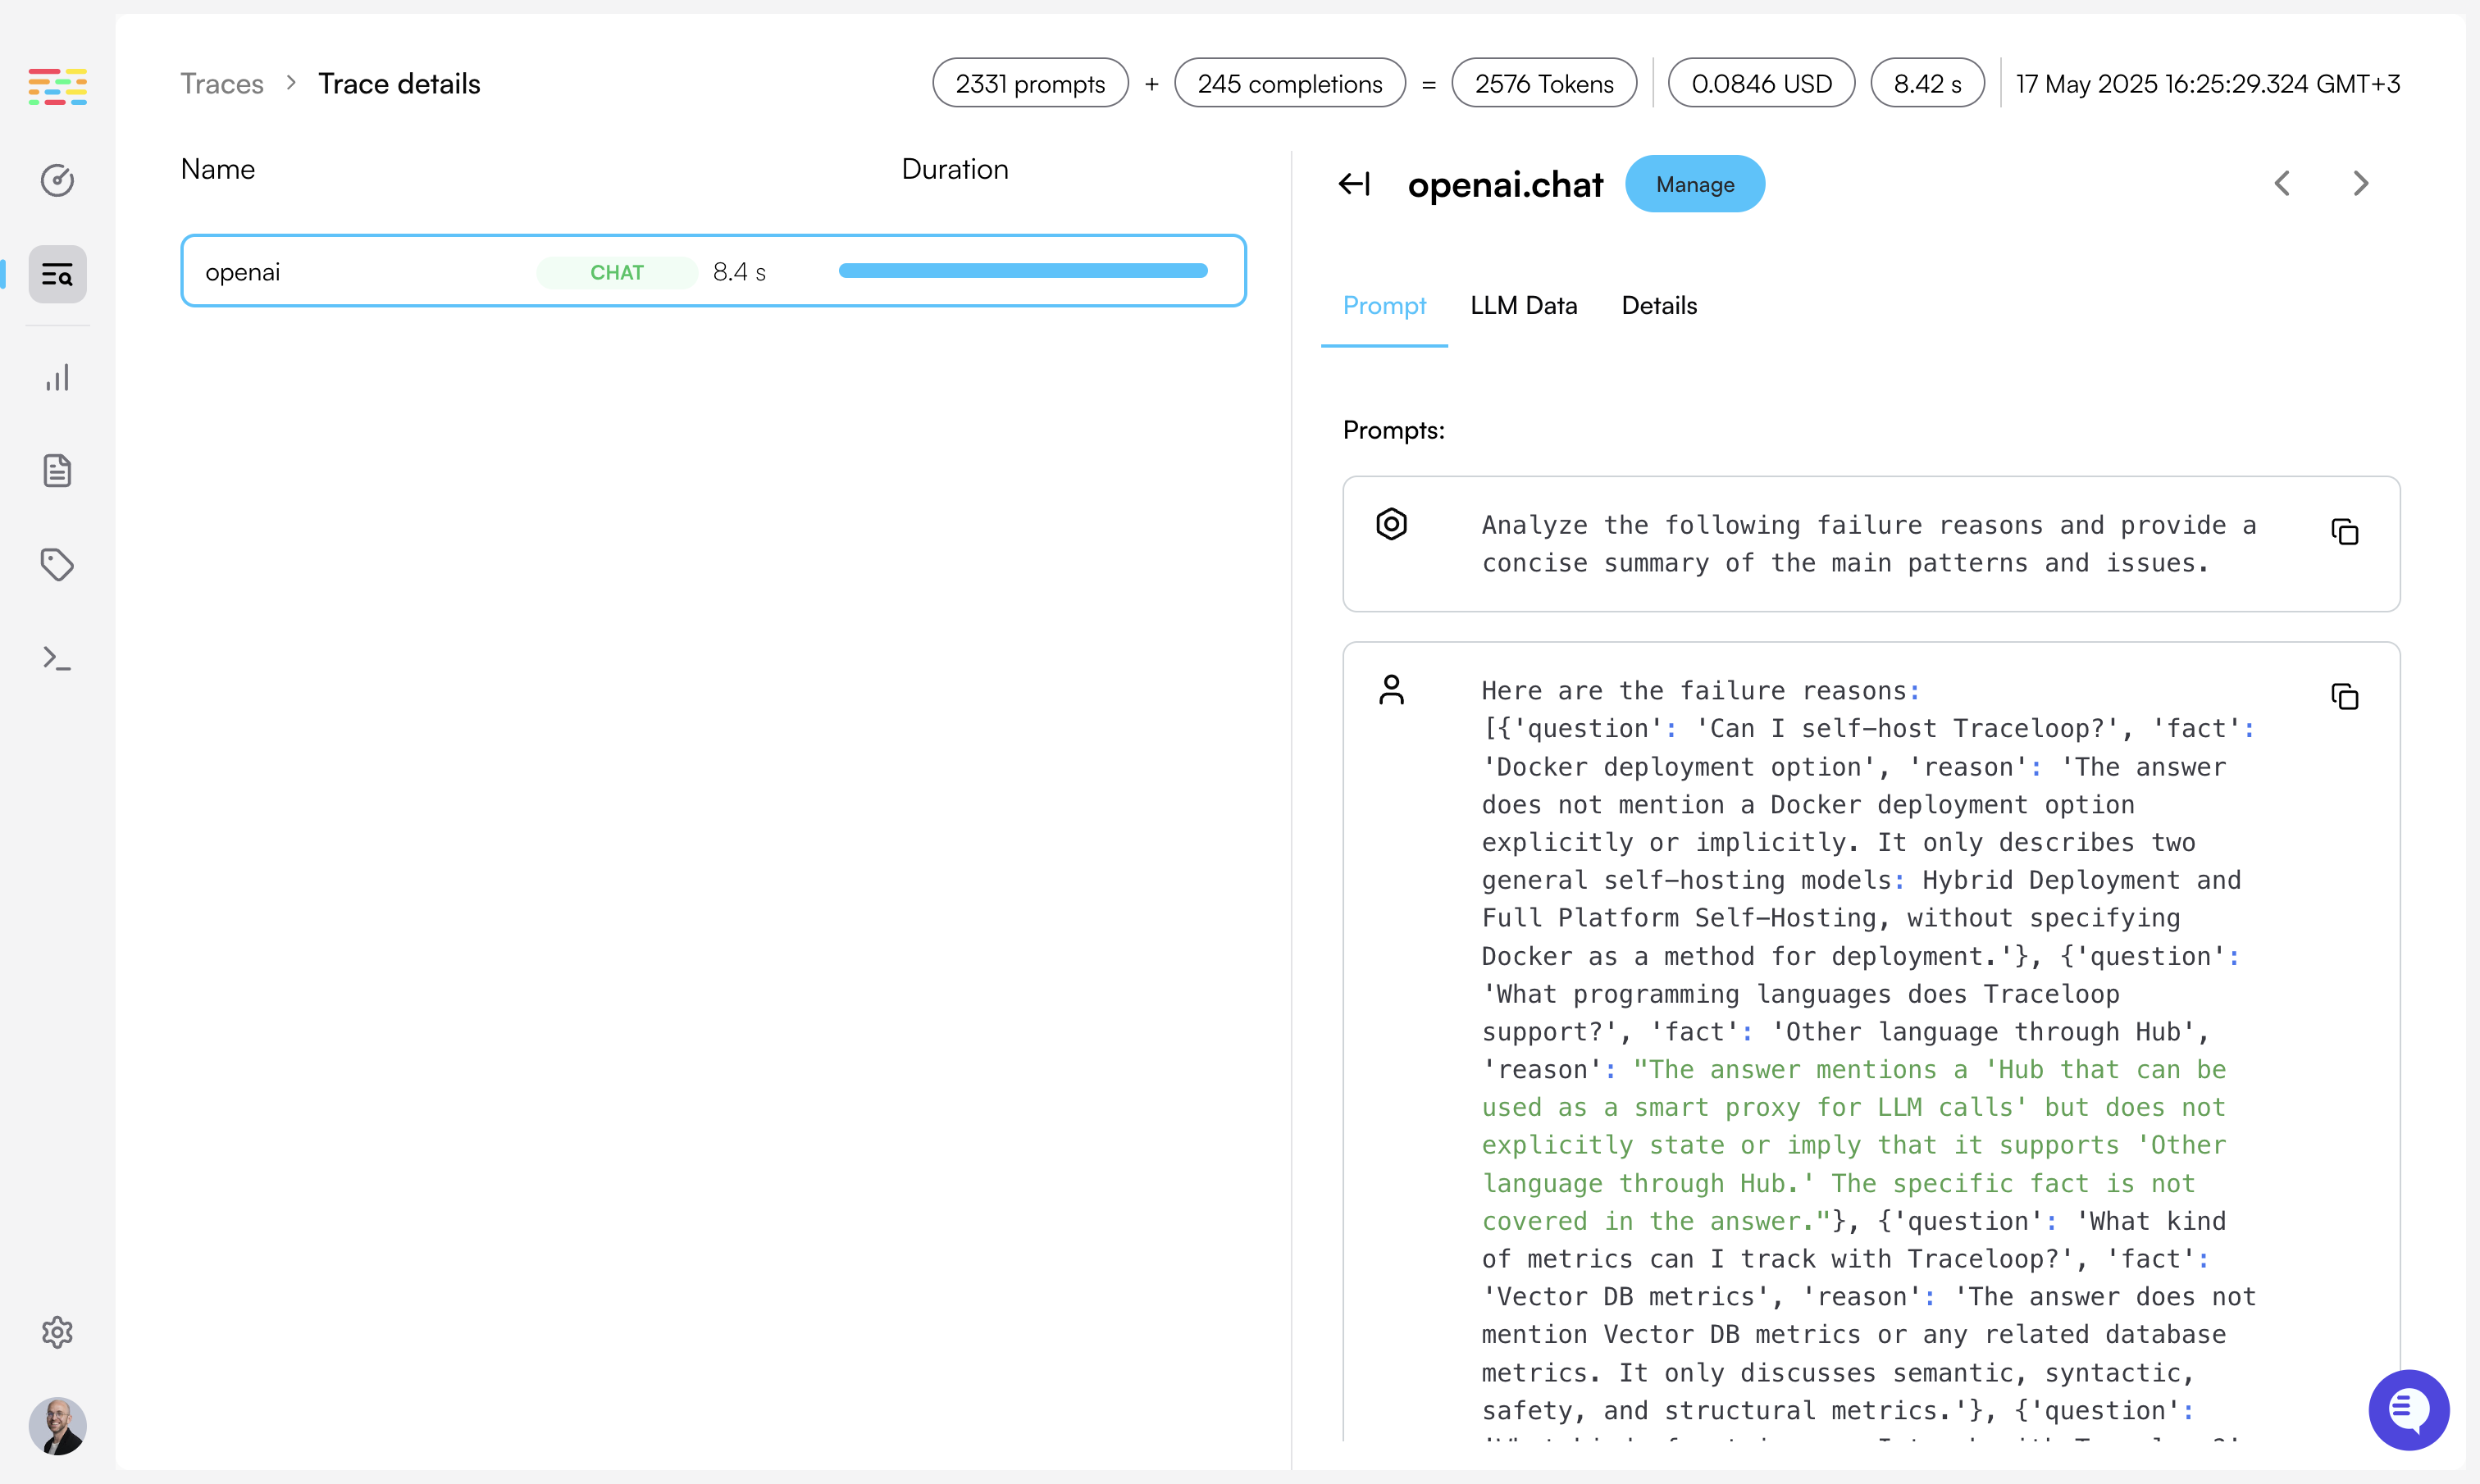
Done! You'll get instant visibility into everything that's happening with your LLM.
If you're calling a vector DB, or any other external service or database, you'll also see it in the Traceloop dashboard.
**Not seeing traces?** Make sure you're viewing the correct project and environment in the
dashboard that matches your API key. See [Troubleshooting](/settings/managing-api-keys#troubleshooting).
For now, we don't automatically instrument libraries on Ruby (as opposed to Python and Javascript).
This will change in later versions.
This means that you'll need to manually log your prompts and completions.
```ruby theme={null}
require "openai"
client = OpenAI::Client.new
# This tracks the latency of the call and the response
traceloop.workflow("joke_generator") do
traceloop.llm_call(provider="openai", model="gpt-3.5-turbo") do |tracer|
# Log the prompt
tracer.log_prompt(user_prompt="Tell me a joke about OpenTelemetry")
# Or use the OpenAI Format
# tracer.log_messages([{ role: "user", content: "Tell me a joke about OpenTelemetry" }])
# Call OpenAI like you normally would
response = client.chat(
parameters: {
model: "gpt-3.5-turbo",
messages: [{ role: "user", content: "Tell me a joke about OpenTelemetry" }]
})
# Pass the response form OpenAI as is to log the completion and token usage
tracer.log_response(response)
end
end
```
Lastly, you'll need to configure where to export your traces.
The 2 environment variables controlling this are `TRACELOOP_API_KEY` and `TRACELOOP_BASE_URL`.
For Traceloop, read on. For other options, see [Exporting](/openllmetry/integrations/introduction).
### Using Traceloop Cloud
You need an API key to send traces to Traceloop.
[Generate one in Settings](https://app.traceloop.com/settings/api-keys) by selecting
a project and environment, then click **Generate API key**.
⚠️ **Important:** Copy the key immediately - it won't be shown again after you close or reload the page.
[Detailed instructions →](/settings/managing-api-keys)
Set the API key as an environment variable in your app named `TRACELOOP_API_KEY`:
```bash theme={null}
export TRACELOOP_API_KEY=your_api_key_here
```
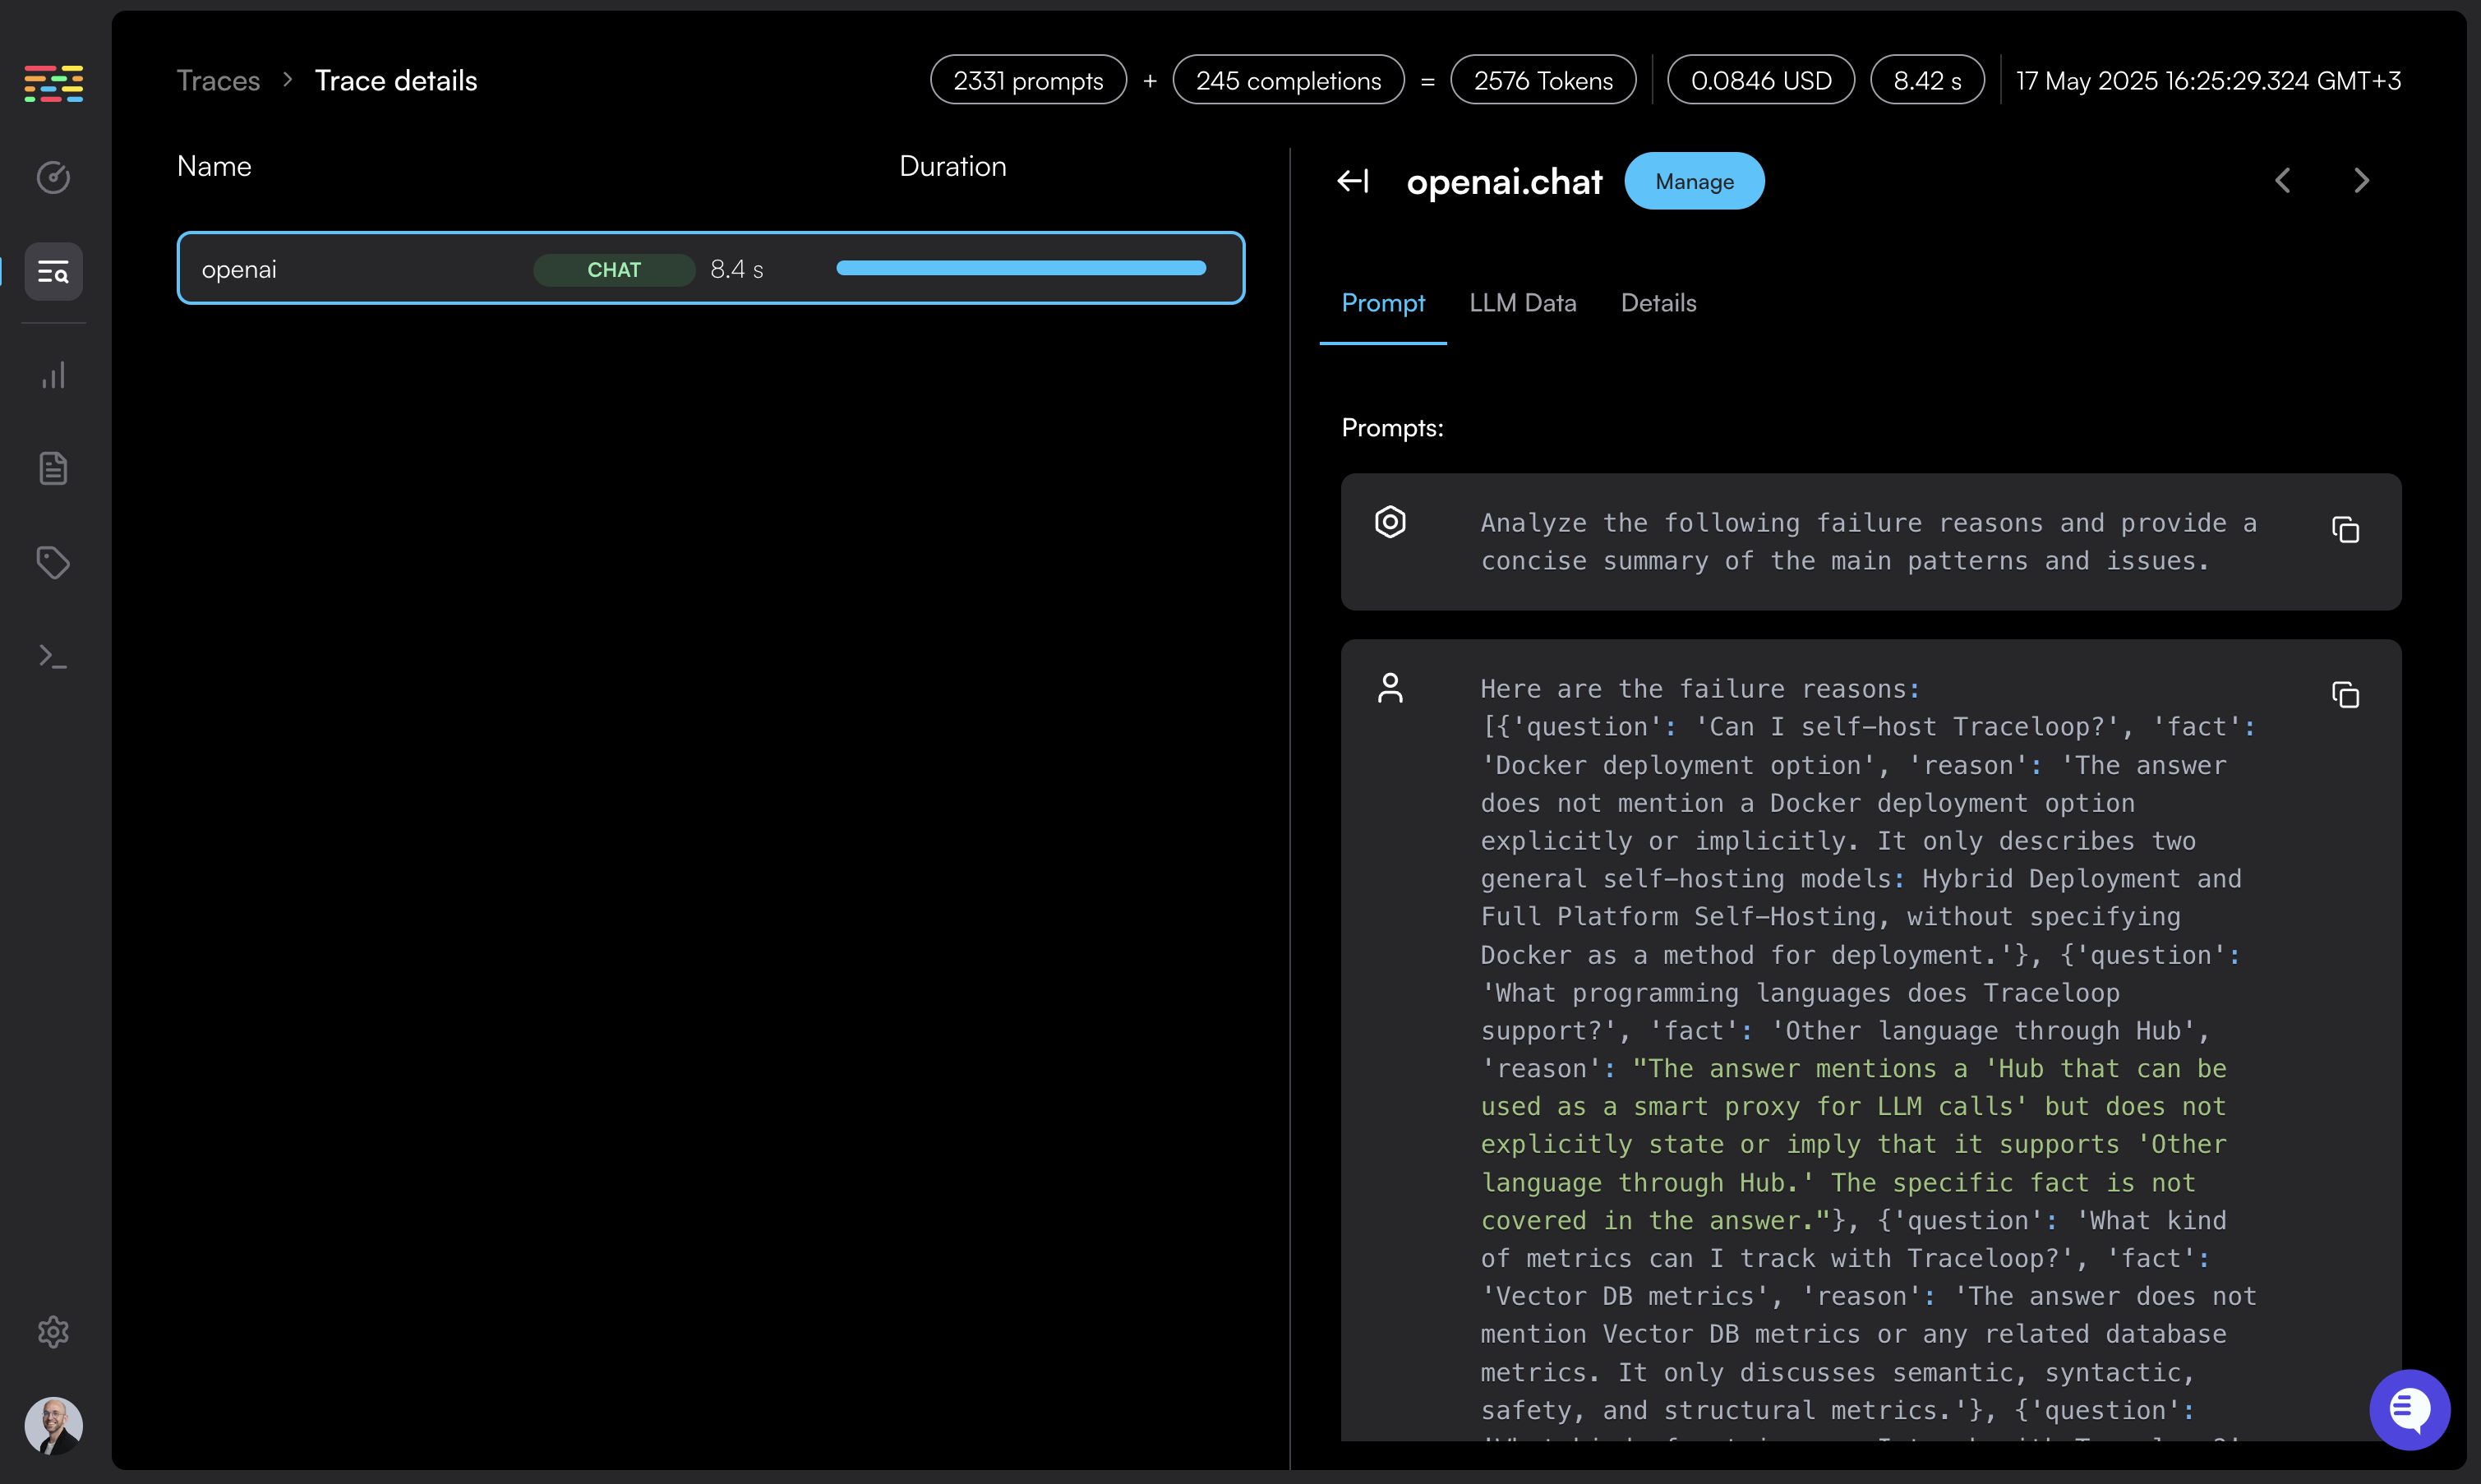
Done! You'll get instant visibility into everything that's happening with your LLM.
If you're calling a vector DB, or any other external service or database, you'll also see it in the Traceloop dashboard.
**Not seeing traces?** Make sure you're viewing the correct project and environment in the
dashboard that matches your API key. See [Troubleshooting](/settings/managing-api-keys#troubleshooting).