> ## Documentation Index
> Fetch the complete documentation index at: https://www.traceloop.com/docs/llms.txt
> Use this file to discover all available pages before exploring further.
# LLM Observability with Splunk and OpenLLMetry
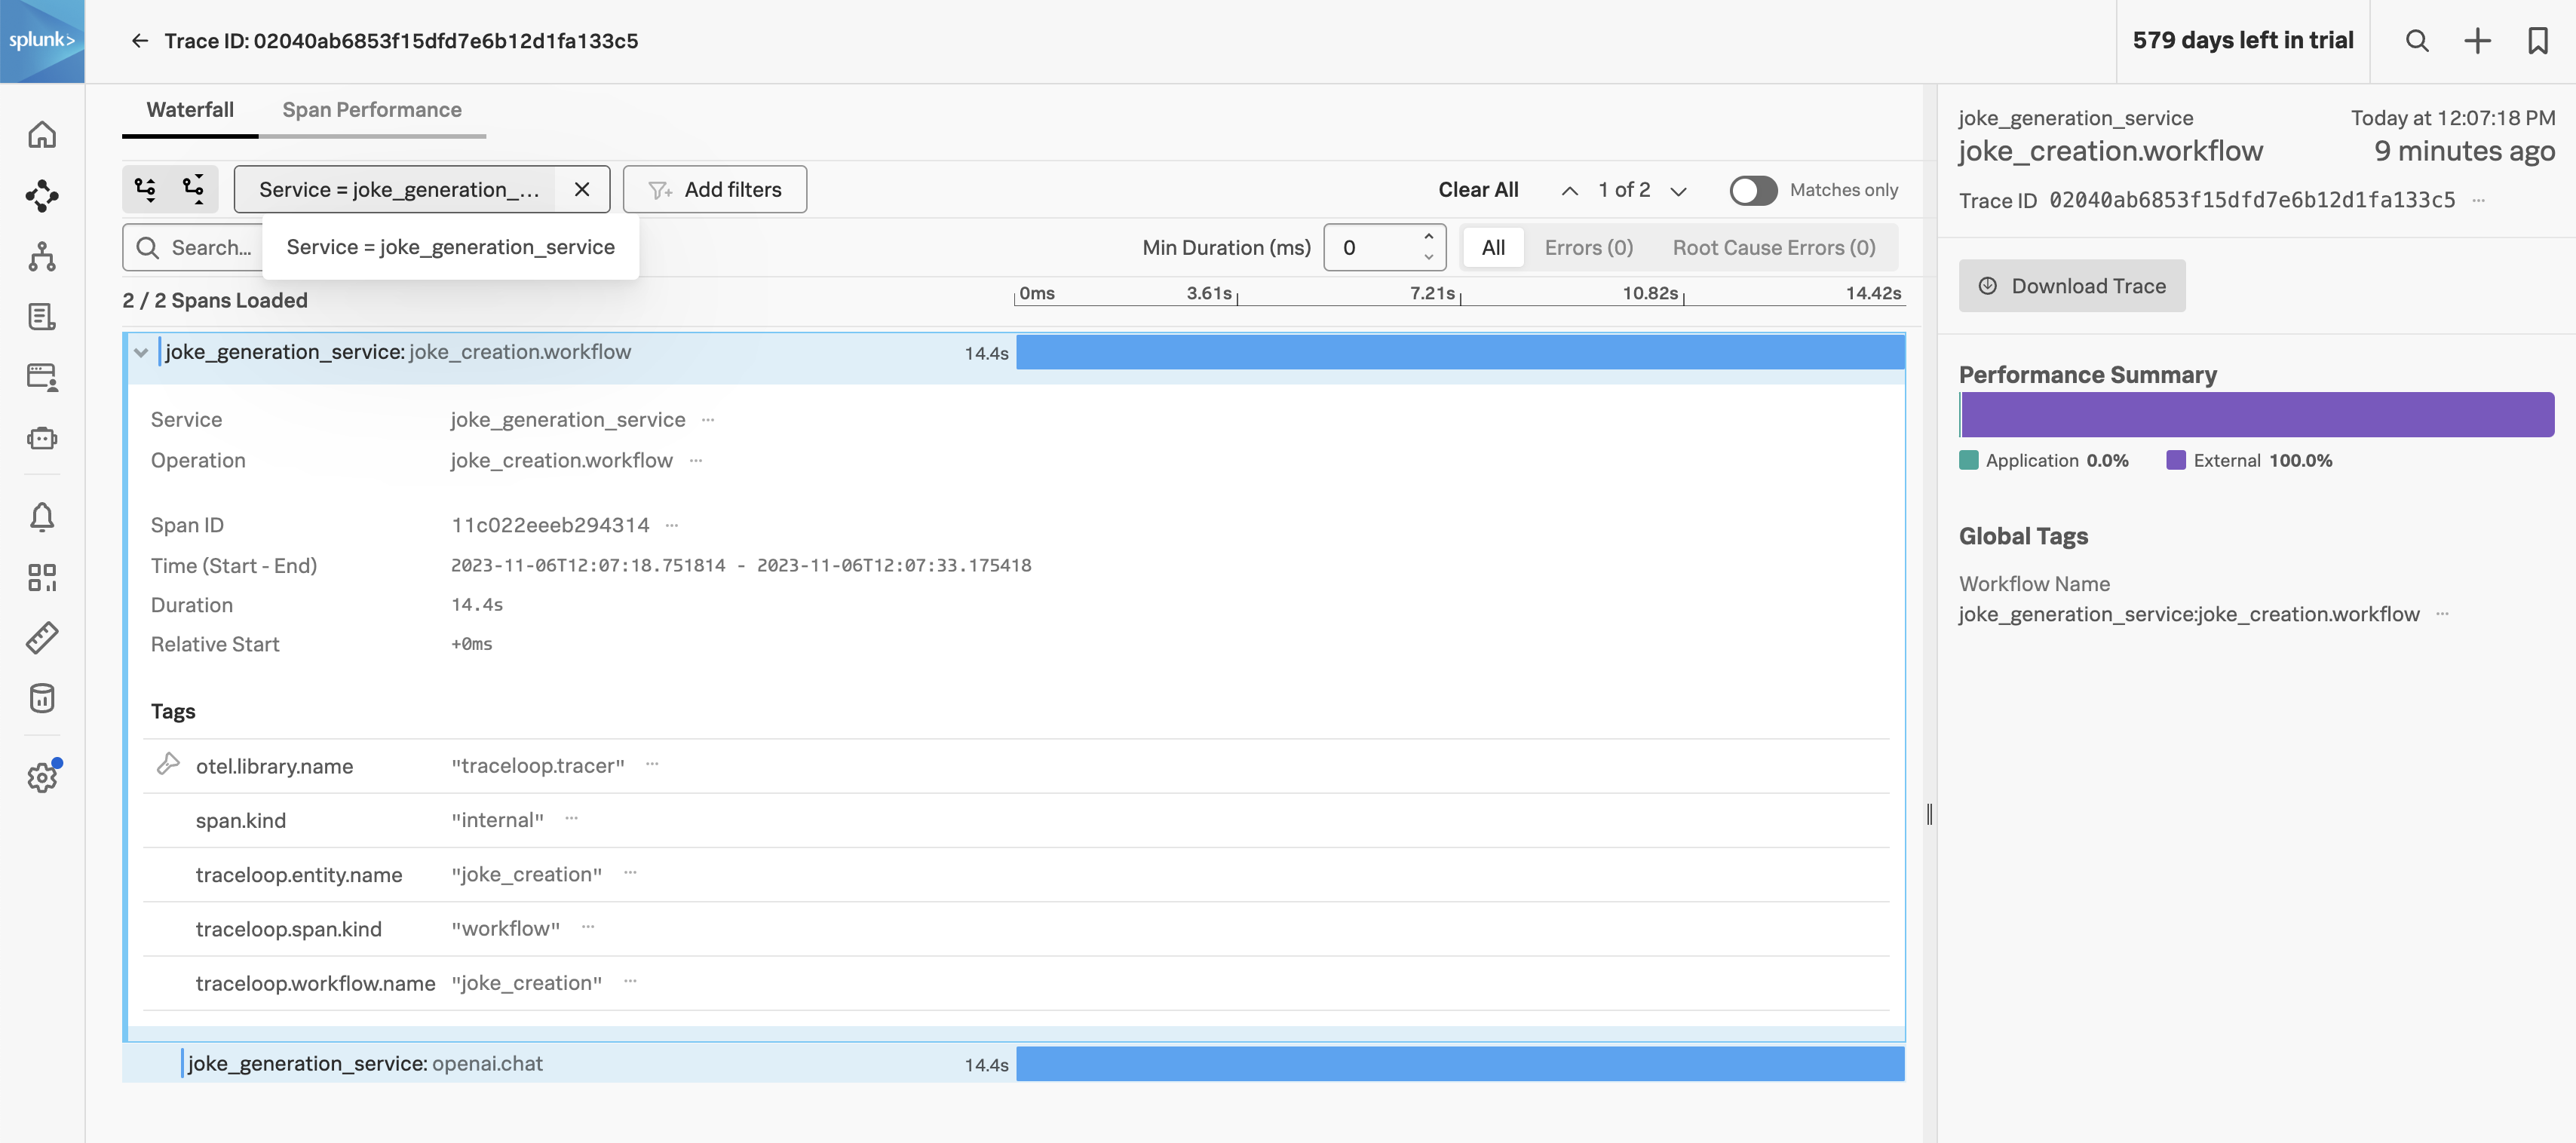 Collecting and analyzing LLM traces in [Splunk Observability Cloud](https://www.splunk.com/en_us/products/observability.html) can be achieved by configuring the **TRACELOOP\_BASE\_URL** environment variable to point to the [Splunk OpenTelemetry Collector](https://github.com/signalfx/splunk-otel-collector/releases) OTLP endpoint.
Have the Collector run in agent or gateway mode and ensure the OTLP receiver is configured, see [Get data into Splunk Observability Cloud](https://docs.splunk.com/observability/en/gdi/get-data-in/get-data-in.html).
```yaml theme={null}
receivers:
otlp:
protocols:
grpc:
endpoint: "0.0.0.0:4317"
http:
endpoint: "0.0.0.0:4318"
```
Secondly, ensure the OTLP exporter is configured to send to Splunk Observability Cloud:
```yaml theme={null}
exporters:
# Traces
sapm:
access_token: "${SPLUNK_ACCESS_TOKEN}"
endpoint: "https://ingest.${SPLUNK_REALM}.signalfx.com/v2/trace"
sending_queue:
num_consumers: 32
```
Thirdly, make sure `otlp` is defined in the traces pipeline:
```yaml theme={null}
pipelines:
traces:
receivers: [jaeger, otlp, sapm, zipkin]
processors:
- memory_limiter
- batch
#- resource/add_environment
exporters: [sapm]
```
Finally, define the `TRACELOOP_BASE_URL` environment variable to point to the Splunk OpenTelemetry Collector OTLP endpoint:
```bash theme={null}
TRACELOOP_BASE_URL=http://:4318
```
Collecting and analyzing LLM traces in [Splunk Observability Cloud](https://www.splunk.com/en_us/products/observability.html) can be achieved by configuring the **TRACELOOP\_BASE\_URL** environment variable to point to the [Splunk OpenTelemetry Collector](https://github.com/signalfx/splunk-otel-collector/releases) OTLP endpoint.
Have the Collector run in agent or gateway mode and ensure the OTLP receiver is configured, see [Get data into Splunk Observability Cloud](https://docs.splunk.com/observability/en/gdi/get-data-in/get-data-in.html).
```yaml theme={null}
receivers:
otlp:
protocols:
grpc:
endpoint: "0.0.0.0:4317"
http:
endpoint: "0.0.0.0:4318"
```
Secondly, ensure the OTLP exporter is configured to send to Splunk Observability Cloud:
```yaml theme={null}
exporters:
# Traces
sapm:
access_token: "${SPLUNK_ACCESS_TOKEN}"
endpoint: "https://ingest.${SPLUNK_REALM}.signalfx.com/v2/trace"
sending_queue:
num_consumers: 32
```
Thirdly, make sure `otlp` is defined in the traces pipeline:
```yaml theme={null}
pipelines:
traces:
receivers: [jaeger, otlp, sapm, zipkin]
processors:
- memory_limiter
- batch
#- resource/add_environment
exporters: [sapm]
```
Finally, define the `TRACELOOP_BASE_URL` environment variable to point to the Splunk OpenTelemetry Collector OTLP endpoint:
```bash theme={null}
TRACELOOP_BASE_URL=http://:4318
```